Topics on This Page
Default Column and Tooltip Displays
Change the Measures in a Tooltip and Hide Columns
Show Data From a Hidden Sort Column in a Tooltip
Default Column and Tooltip Displays
By default, all columns display when you drag them into Measures or Categories in the Chart Builder.
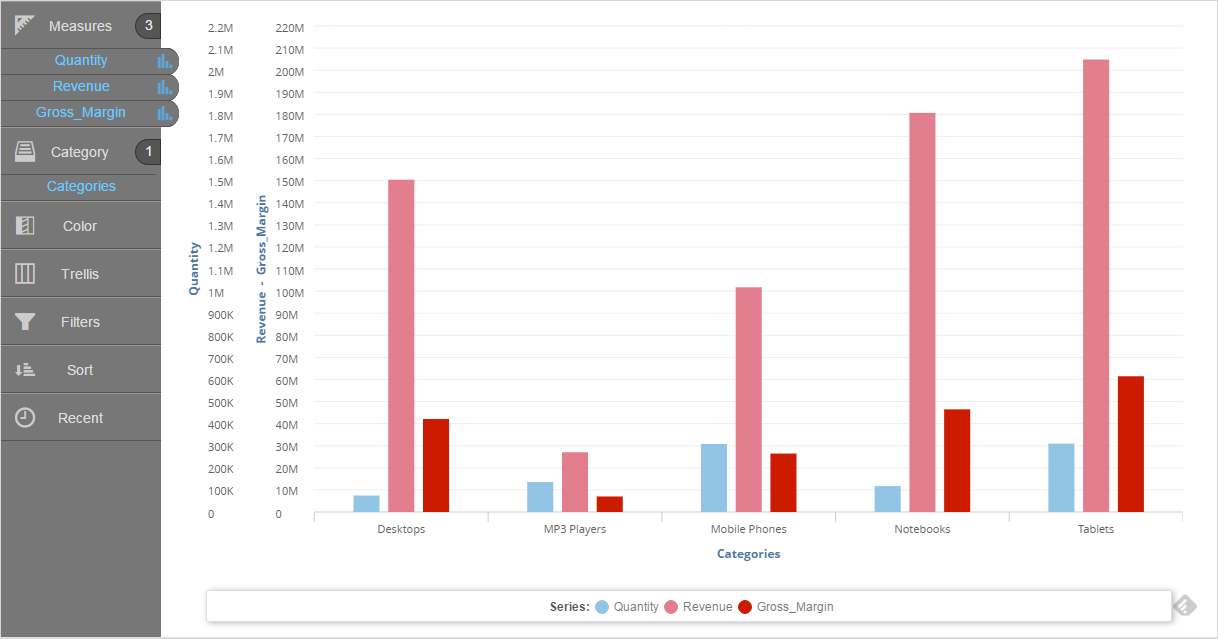
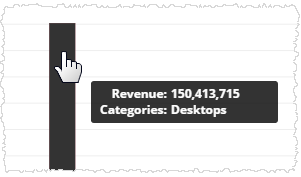
By default, tooltips display the following:
- The measure name and data for the column;
- The attribute name and value.
Change How Tooltips Display
Use the following methods to change the look of tooltips:
- Colors and fonts—By default, tooltips have a black background with white text. You can change the text.
- Format style for prefixes, suffixes, and decimal precision—You can format styles consistently at the chart level or override chart-level settings for individual columns.
Change the Measures in a Tooltip and Hide Columns
You can change the measures that display in a tooltip, which also involves hiding columns:
- Display hidden column data in the tooltip of another column—You can hide a column from the report and have its data display only in the tooltip of another measure.
- Show multiple measures in tooltips—Tooltips can show multiple measures.
- Completely hide a column—You can use a combination of the previous two methods to hide a column entirely.
Show Data From a Hidden Sort Column in a Tooltip
For some reports, you may want to sort or filter by a particular column without showing the column in the chart or table. In the Measures Properties' Chart Type panel, you can choose not to display the column and instead use a tooltip to show it when the cursor hovers over the displayed measure column or columns.
For example, to sort by Revenue, hide it from the chart, and show it in the tooltips of Quantity and Revenue:
- Drag Revenue from the Measures section to the Sort section and set it to Descending.
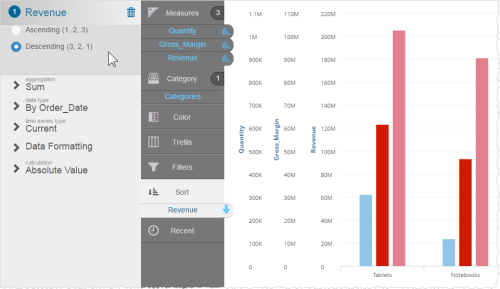
- In the Measures section, click Revenue.
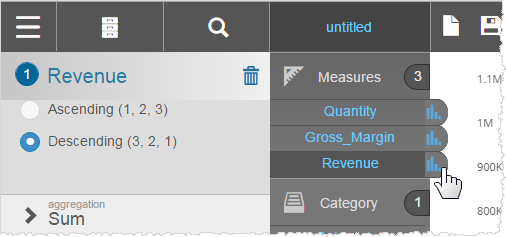
- In the Revenue Chart Type panel, click Show Only in Tooltip.
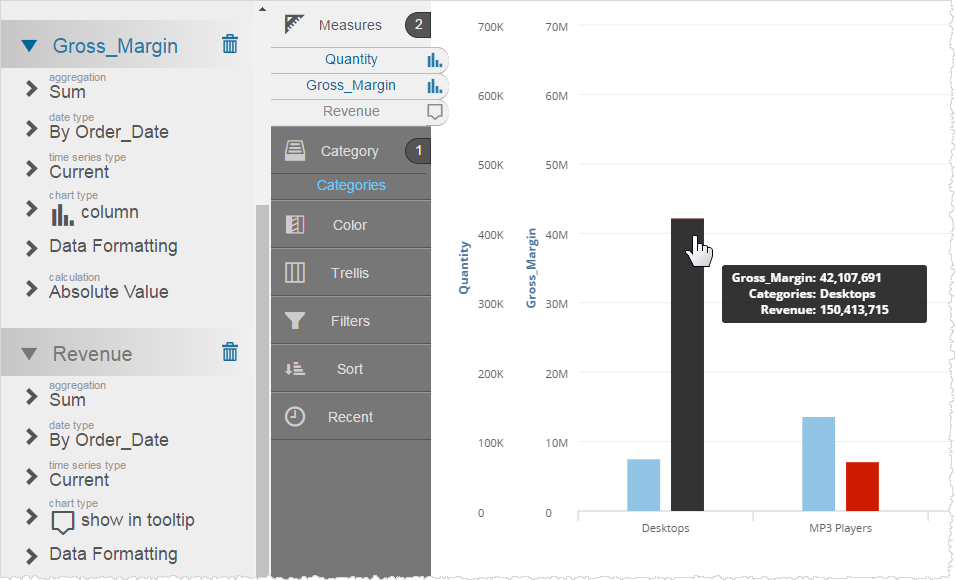
The measure no longer displays in the main report; it displays only in the tooltip of the other measure.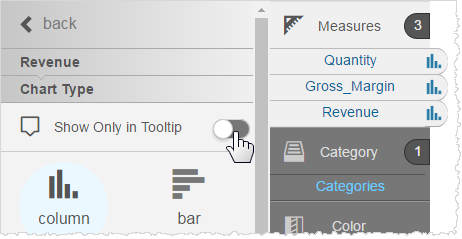


Show Data From Multiple Columns in a Tooltip
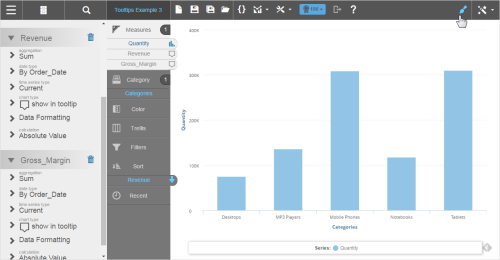
By default, when you set measures as Show Only in Tooltip, tooltips display all of the measures. You can change which measures are displayed or not displayed.
- In a chart that has multiple measures configured with Show Only in Tooltip, open the Chart Formatting panel.
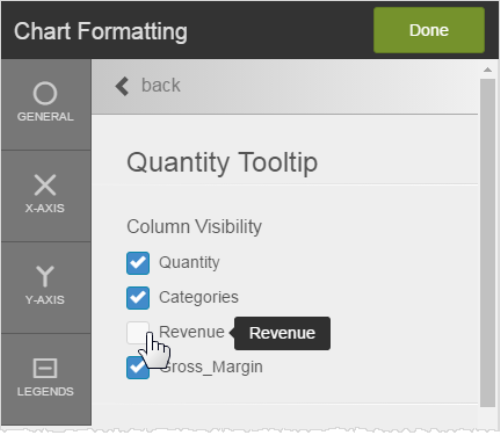
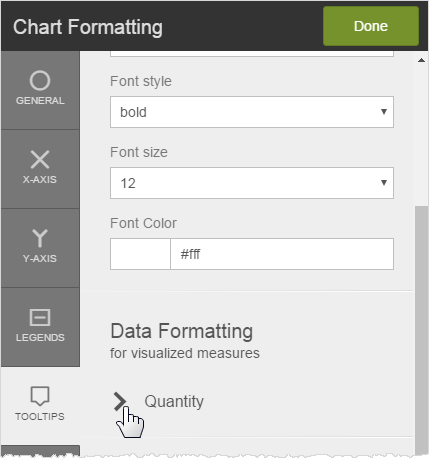
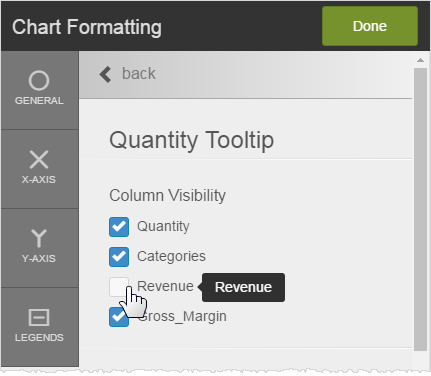
- In the Chart Formatting pop-up, click Tooltips → Data Formatting. Click the name of the measure that has the tooltip you want to change.
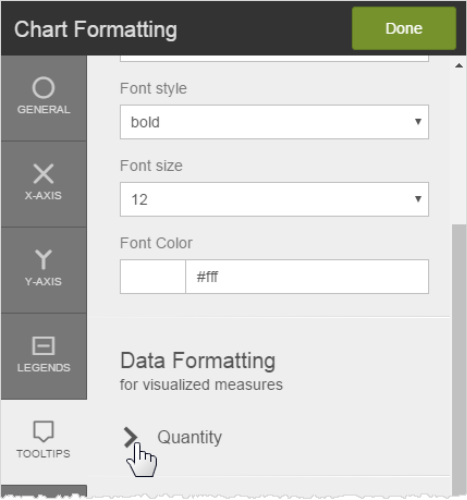
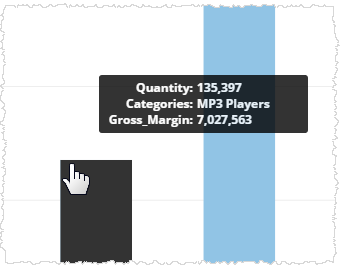
- In the Column Visibility section, clear the data you don't want to see in the tooltip. The measure data no longer displays in the tooltip.

Completely Hide a Column
You can hide a column from both the report display and from tooltips.
- In the Chart Type panel for the measure, enable Show Only in Tooltips.
- In the Chart Formatting Tooltips tab, clear each measure in Column Visibility.

